AWS Big Data Blog
How Coursera Manages Large-Scale ETL using AWS Data Pipeline and Dataduct
| February 2023 Update: Console access to the AWS Data Pipeline service will be removed on April 30, 2023. On this date, you will no longer be able to access AWS Data Pipeline though the console. You will continue to have access to AWS Data Pipeline through the command line interface and API. Please note that AWS Data Pipeline service is in maintenance mode and we are not planning to expand the service to new regions. For information about migrating from AWS Data Pipeline, please refer to the AWS Data Pipeline migration documentation. |
This is a guest post by Sourabh Bajaj, a Software Engineer at Coursera. Coursera in their own words: “Coursera is an online educational startup with over 14 million learners across the globe. We offer more than 1000 courses from over 120 top universities.”
At Coursera, we use Amazon Redshift as our primary data warehouse because it provides a standard SQL interface and has fast and reliable performance. We use AWS Data Pipeline to extract, transform, and load (ETL) data into the warehouse. Data Pipeline provides fault tolerance, scheduling, resource management and an easy-to-extend API for our ETL.
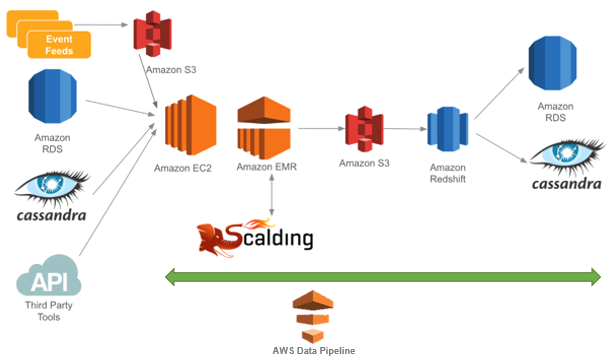
Dataduct is a Python-based framework built on top of Data Pipeline that lets users create custom reusable components and patterns to be shared across multiple pipelines. This boosts developer productivity and simplifies ETL management. At Coursera, we run over 150 pipelines that pull data from 15 data sources such as Amazon RDS, Cassandra, log streams, and third-party APIs. We load over 300 tables every day into Amazon Redshift, processing several terabytes of data. Subsequent pipelines push data back into Cassandra to power our recommendations, search, and other data products.
The image below illustrates the data flow at Coursera.
In this post, I show you how to create pipelines that you can use to share custom reusable components and patterns across pipelines.
Creating a simple pipeline
You can start by creating a simple pipeline. The first example pulls user metadata from RDS and load it into Amazon Redshift:
name: users
frequency: daily
load_time: 12:00
description: Users table from RDS database

steps:
-   step_type: extract-rds
    sql: SELECT id, user_name, user_email FROM users
    host_name: maestro
    database: userDb

-   step_type: create-load-redshift
    name: load_staging
    table_definition: tables/staging.maestro_users.sql

-   step_type: upsert
    name: upsert_users
    source: tables/staging.maestro_users.sql
    destination: tables/prod.users.sql

# QA tests
-   step_type: primary-key-check
    depends_on: upsert_users
    table_definition: tables/prod.users.sql

-   step_type: count-check
    depends_on: upsert_users
    source_sql: SELECT id FROM users
    source_host: maestro
    destination_sql: SELECT user_id FROM users
    tolerance: 2.0
The figure below shows the pipeline steps as a DAG (directed acyclic graph).
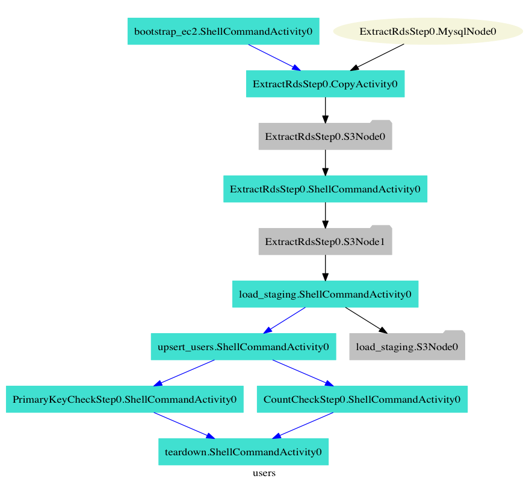
As you can see in the above pipeline, you define the pipeline structures in a YAML file. They are then saved in a version control system to track how these pipelines evolved over time. The following steps illustrate how reusable components are created for use in different pipelines.
Step 1: extract-rds. Takes in a SQL query and database name to read data. Credentials are passed through a configuration file that is shared across all pipelines.
Step 2: create-load-redshift. Creates a table if it doesn’t exist and loads data into the table using the COPY command in Amazon Redshift.
Step 3: upsert. Takes the data in the staging table and updates the production table with any values that need to be inserted or updated.
Step 4: primary-key-check. Checks for primary key violations in the production table.
Step 5: count-check. Compares the number of rows between the source database and Amazon Redshift.
The validation steps compare the data between the source system and warehouse for data quality issues that may arise during ETL, by checking for the following cases:
- Primary key violations in the warehouse.
- Dropped rows, by comparing the number of rows.
- Corrupted rows, by comparing a sample set of rows.
Notice that there is a bootstrap and a teardown step for the pipeline. These steps are specified in the configuration. The bootstrap step can be used to install dependencies and upgrade to the latest version of the code so that you don’t have to redeploy each pipeline every time the pipeline code is updated. Similarly, the teardown step can be used for triggering SNS alerts on failure.
Creating a more complex pipeline
Let’s consider a more complicated pipeline that pulls data from Cassandra to Amazon Redshift. In this example, you use Aegisthus to read and parse Cassandra backups and Scalding to transform and normalize the data into TSV files for loading into Amazon Redshift.

As you can see below, the Aegisthus and Scalding steps use ShellCommandActivity in Data Pipeline to run scripts and commands on the EMR cluster. The Aegisthus step takes in the Cassandra schema to be parsed. It then reads the data from backups in S3 and writes back to an output node. The Scalding step runs a series of MapReduce jobs to create different output nodes for each table to update in Amazon Redshift. This example uses shell command activity to extend the simple case I discussed in the first pipeline.
name: votes
frequency: daily
load_time: 04:00

emr_cluster_config:
    num_instances: 20
    instance_size: m1.xlarge

steps:
-   step_type: aegisthus
    cql_schema_definition: cassandra_tables/vote.vote_kvs_timestamp.cql

-   step_type: scalding
    name: vote_emr
    job_name: org.coursera.etl.vote.VotesETLJob
    output_node:
    -   questions

-   step_type: create-load-redshift
    name: load_discussion_question_votes
    input_node: questions
    depends_on: vote_emr
    table_definition: tables/staging.cassandra_discussion_question_votes.sql

-   step_type: reload
    name: reload_discussion_question_votes
    source: tables/staging.cassandra_discussion_question_votes.sql
    destination: tables/prod.discussion_question_votes.sql
Building your own pipelines
To learn more about Dataduct and to get started developing your own pipelines, read the Dataduct documentation. You can install the library using pip and start by running the example pipelines provided with the code on Github.
Conclusion
Dataduct helps us easily maintain the pipelines and allows product developers to create pipelines with minimal involvement from the Data Infrastructure team. AWS Data Pipeline is flexible and provides great support for resource management, fault tolerance and scheduling. Using Data Pipeline to monitor pipeline run times, query times, retries, and failures can reveal inefficiencies in pipelines. Leverage shared code across pipelines as much as you can; your goal should be to redeploy the pipeline only when the steps in the pipeline change.
Dataduct is open source under the Apache 2.0 License, so please contribute with ideas, issues, and pull requests to make the project better. I will be at speaking at re:Invent 2015, so get in touch with me at @sb2nov if you want to chat more about Coursera or Dataduct.
If you have questions or suggestions, please leave a comment below.
Saurabh Bajaj is not an Amazon employee and does not represent Amazon.
Related
Introducing On-Demand Pipeline Execution in AWS Data Pipeline